menu   Home About Me Home freebies My Store  
 photo 3am_AB_f1_zps652b0c0f.png    photo 3am_ab_gplus_zps3ab6fefc.png    photo 3am_ab_pin_zpsbfebd6d2.png    photo 3am_tpt1_zpse91e0740.png   photo 3am_ab_email1_zpsebc98a17.png

Search My Blog

Microscope Fun!


Last week, I remembered a very important lesson in school teaching..... Sometimes the simple things work the best in the classroom!

What do you do in high school biology on a day that is destroyed by homecoming interruptions?  Pull out the microscopes and let the kids have some fun!  I have a great 2-day lab that I have used in the past on the microscope.  I haven't used it in a few years because I have been favoring labs that are more "technology oriented" that use probes, graphing calculators, and spectrophotometers.  But I was reminded last week that sometimes the kids like the "old stuff" like a good old fashioned microscope.

During two days of homecoming activities at our school, I knew that my students would be bouncing off the walls, and we were running an abbreviated schedule each day.  I pulled out my old tried and true microscope lab and put the students to work.  They looked at all kinds of things and had a blast doing it.  I had forgotten how excited students can get about pond water!

My lab has 5 parts:

  • In the first part, students compare plant cells to animal cells.  I used onion skin as the plant cell and cheek cells as the animal cell.  
  • The second part is called "Cells with Chloroplasts."  Students looked at the leaf from the Elodea plant. 
  • The third part is called "Cells with Chromoplasts."  Students looked at the skin from an apple or a tomato.
  • The fourth part is called "Storage in Cells."  The students placed a bit of potato pulp on a slide, added a drop of iodine, and observed the very large starch grains found inside the cells.
  • The fifth part of the lab is "Fun with Pond Water."  My students had a blast with this.  I gave extra credit to students who brought in pond water samples, and we had many samples to choose from.
It was very gratifying to see the students have so much fun with such a simple activity.

Have fun teaching!!

Very Simple Diffusion and Osmosis Experiment


A Simple Osmosis and Diffusion Lab That Makes Cellular Transport Click with Biology Students


Teaching cellular transport in biology can sometimes feel like throwing vocabulary words at a wall. Terms like diffusion, osmosis, active transport, passive transport, hypotonic, hypertonic are often intimidating for our students. If you're looking for a simple, visual, and memorable diffusion and osmosis lab that brings these concepts to life, this lab is for you.


This hands-on activity using dialysis tubing has become a staple in my biology classroom. It’s easy to set up, powerful in its visual results, and it helps students understand semipermeable membranes, molecular size, and passive transport without the need for fancy lab equipment.


The Setup: Two Bags, Two Solutions, One Powerful Lesson


Students are given two pieces of dialysis tubing. One piece of tubing is filled with starch solution, the other with glucose solution. Each is placed in a separate cup of tap water. To the cup containing the starch-filled bag, students add iodine.


The visual results start almost immediately. Within minutes, students see the dialysis tubing turning purple or bluish black, a dramatic visual change that signals diffusion is taking place. The students can see that the iodine molecules move across a semipermeable membrane and react with the starch. Meanwhile, students use glucose test strips to check whether glucose molecules have diffused out into the water of the second cup.


What Students Learn from this Osmosis/Diffusion Lab


By analyzing their results, students make key observations:

  • Starch didn’t leave the bag.
  • Iodine entered the bag.
  • Glucose slowly diffused out, with positive test strip results appearing only after 24 hours.
  • Water moved into the bag, as shown by swelling.


These outcomes open the door for class discussions about molecular size, permeability, and the differences between active and passive transport. I also challenge students to rank the molecules from smallest to largest based on which ones could pass through the membrane. 


Ready to Try It?


The version of the lab I use in my classroom is available here:

👉 Diffusion Through a Non-Living Membrane


It comes with student instructions, a detailed teacher guide, data tables, and analysis questions ... everything you need for a smooth, engaging class period.


Want to go further? Try this FREE download:

🎁 The Effect of Concentration on the Rate of Diffusion
 - This is a great follow-up or extension that deepens students' understanding of how concentration gradients affect the rate of diffusion.


More Resources to Reinforce Cellular Transport


Need additional reinforcement activities for your cell transport unit? These are teacher favorites in my TPT store:

    🧪 Cellular Transport Worksheets – Lots of practice requiring critical thinking skills.

    💧 Qualitative and Quantitative Plasmolysis Lab – Hands-on exploration of osmosis in plant cells

    🎨 Cellular Transport Color by Number – Fun, low-prep review with instant feedback


Why This Lab Works


This osmosis and diffusion lab works because it’s:

    Simple to prep

    Visually powerful

    Aligned with NGSS and common biology standards

    Appropriate for high school biology

    Engaging enough that students remember the results


Whether you're introducing the topic for the first time or reviewing before an exam, this lab creates the kind of “aha!” moment every biology teacher hopes for. Good luck and happy teaching!


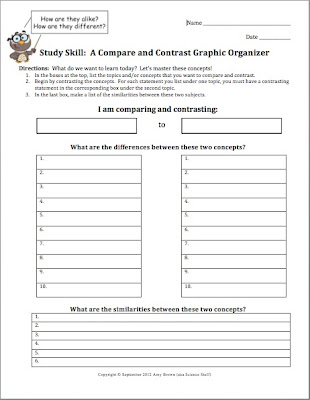
A Compare and Contrast Graphic Organizer


With the increasing amount of information that our students are expected to learn and master, it is more important than ever to provide them with the tools they need to organize and study difficult concepts.

This free graphic organizer can help your students learn to delve deeper into the content to search for similarities and differences between two topics or concepts.

Click image for free download.

This can be used in all subject areas and in grades 4 and up.  My students even admit that this technique has improved the way they view the content that we cover each day.  The graphic organizer can be used to compare and contrast any two topics or concepts.  I have used this organizer to have my students compare and contrast:
  • Photosynthesis to cellular respiration
  • Mitosis to meiosis
  • Protostomes to deuterostomes
  • Vascular plants to nonvascular plants
  • Systems of the body
  • DNA to RNA


The printable version is perfect for traditional classroom settings, and the paperless, digital Google Apps version is perfect for distance learning and 1:1 classrooms.

You can download this free graphic organizer by clicking on any of the above pictures, or on this link:


Enjoy!  ...And have fun teaching!


Math and Biology: Math Every Day!


We must increase the use of biology mathematics in our lessons!

I am WAAAAYYYY up high on my soapbox today.  This is year #29 for me in the biology classroom.  I have been seeing this shameful trend for several years now..... Students cannot do math in the biology classroom!

In the past, biology was a largely descriptive science.  We had our students peer into microscopes day after day.  Lab reports consisted of many drawings, hopefully drawn in pretty colors with the "parts" accurately labeled.  Now don't get me wrong;  I still love a microscope.  I can sit for hours and look at drops of pond water.  It is still, after all these years, absolutely fascinating to me!  Moreover, my students still love these types of labs.  However, several years ago, I began to change the type of lab I use in my biology classroom.  I now favor a lab that is quantitative and requires the use of math in biology.

Math & Science:  The Problems I Face Each Day

This is what I see everyday in my classroom.  I know that science teachers everywhere will shake their heads in agreement with these problems.

  • Students cannot do even the simplest of arithmetic without a calculator!  Why, oh why, did we (educators) ever decide it was okay to let students learn math at the elementary levels by using a calculator?  I would like to be the leader of the "Ban the Calculator" movement.  Yes, I am being overly dramatic.  The calculator is a very useful tool, but many of our students are so "calculator-dependent" that they have lost the meaning of the math.

  • Students do not have any common sense when it comes to math.  In their minds, whatever comes up on the calculator display MUST be the right answer. They do not stop to think if the answer is reasonable.  
  • Students cannot do arithmetic.  I wager to say that if I passed out a test that required the use of long division, many of my students might fail.  Further, many students don't know their times tables.  Over and over, I will see a student reach for calculator to multiply two numbers that they should already know!  Funny (but not funny) is that many of my AP Biology students are excelling in AP Calculus, but can't do arithmetic!
  • In the middle school grades, we need to quite teaching algebra and geometry and teach fractions, decimals, and percents every single year.
The Course That I Now Teach? Mathematical Biology!

I am slowly, but surely, changing the types of materials that I use in my class.  I am making more of my labs, activities, worksheets, and homework assignments quantitative in nature.  I am sometimes restricting the use of a calculator during my class.  Recently I purchased a classroom set of four-function calculators.  They only add, subtract, multiple and divide!  When I do allow students to use a calculator in my class, this is the only calculator they get to use.

If you want to make your science class more math-based, I have several products that you might want to consider.  Let's start with the ones that are FREE!  Click on the links below and you can download these "math in biology" lessons for free.


This school year, I developed three new activities that are math-based.  I have already used these in my classes, and I am very pleased with the results.

Have Fun Teaching!

Free Materials for Science Teaching


Always Free!

I currently have 18 free products for teaching biology and chemistry to students in grades 7 - 12.  These freebies are tried and true.  I use them all the time in my classes, so they are guaranteed to be kid tested and user friendly.

These materials are ready to be copied and passed out to your students.  Each product includes worksheets/handouts for the student, and guides for the teacher.  Answer keys are always included.

Click this link to see all of my freebies.

Enjoy!


How Do Living Cells Deal With Changes in pH?


One of My Favorite Labs .... and My Students Love It, Too!!

The chemical reactions that occur within living cells are required for life, but often result in creating a hazardous work place for the cell organelles.  Many of the biochemical reactions that occur produce end products that affect the pH of the cell.  Every cell has an optimum pH at which the cell will best function.  If the pH of the cell environment varies from the optimal pH too much, the cell could die. It is vital that cells be able to manipulate their environment to maintain a pH of optimal functioning. Thankfully, cells can produce buffers which help to maintain a stable pH inside living cells.  Buffers are substances that are either weak acids or weak bases that are produced in response to the cell becoming too acidic or too basic.

The technical definition of a buffer is:  "A substance that consists of acid and base forms in a solution and that minimizes changes in pH when extraneous acids or bases are added to the solution."   A great example of buffers in living systems is seen in human blood.  The pH of human blood is close to 7.4.  A person cannot survive for more than a few minutes if the blood pH drops to 7 or rises to 7.8.  It is critical that the pH of 7.4 is maintained.  The presence of buffers in the blood allows for a relatively constant pH despite the addition of acids and bases.  Buffers minimize changes in the concentrations of H+ and OH- ions.  They do so by accepting hydrogen ions when they are in excess and by donating hydrogen ions to the solution when they have been depleted.

This principle can be demonstrated to your students by a very simple, (but pretty amazing!) lab experiment.  I have to admit that each school year I really look forward to doing this lab!  It is very easy to set up, doesn't require fancy pieces of lab equipment, works every time, and most importantly, my students are usually very impressed by the results.

Here are the key point to the lab:
  • Students begin by placing tap water in a beaker. They add drops of dilute acid one drop at a time and record the pH after each drop.  They repeat a second time, but add a dilute base. Predictably, the pH drops significantly with the addition of the acid and rises significantly with the addition of the base.  This serves as a control, showing what happens to the pH when no buffers are being produced.
  • Now it is time to test living cells.  Students are given a liver homogenate (liver ground up in blender) to which they add drops of acid and base.  There is very, very little change in pH.  Students will often call me over and say that their pH meter is not working because there is so little change in the pH readings.  It is immediately obvious to the students that the cells are producing buffers to control their pH.  
  • Repeating the process with raw potato proves that plant cells also produce buffers.
  • Results are graphed and followed by final analysis questions.
I use the pH meter that you see in this photo.  These are relatively inexpensive and are pretty durable. The set that I use has been in use for years, and they are still going strong.  Batteries are easily replaceable, but rarely need to be replaced.  If pH meters are unavailable, this lab can easily be conducted using pH paper.

This is one of my favorite labs that I do with my Biology students.  It clearly shows the concept of buffers, it requires the students to use good lab techniques, the students must table large amounts of data, and the data must be graphed.  Much is accomplished by this lab! This lab is suitable for grade 8 and up.  I hope that you will give this lab a try.  You will not be disappointed.

Want to view this lab in my TpT store? Click the image below.