menu   Home About Me Home freebies My Store  
 photo 3am_AB_f1_zps652b0c0f.png    photo 3am_ab_gplus_zps3ab6fefc.png    photo 3am_ab_pin_zpsbfebd6d2.png    photo 3am_tpt1_zpse91e0740.png   photo 3am_ab_email1_zpsebc98a17.png

Search My Blog

Showing posts with label graphic organizer. Show all posts

Concept Mapping in the Science Classroom: What Are You Waiting For?


Concept Maps and Graphic Organizers:  Two Tools for Success in the Science Classroom.

What is a sure-fire way to make our students hate taking a science class? Completely overwhelm them with facts, figures, data, definitions, comparisons,  diagrams, charts, tables, memorizing the textbook ... Well, I think you get the point.

There is no getting away from the fact that a science class has a lot of information!  We definitely should be teaching our students the big ideas and concepts, but these big ideas don't mean a lot if the underlying supporting information is not there.  Our science students are going to have to learn a lot of new vocabulary and definitions.  But we can make the job of learning big chunks of information a bit more manageable.  Successful students are happy students!

The idea of concept mapping is not new or innovative.  It is, however, often neglected as a tool to help our students.  Students do not naturally know how to take information and organize it into a logical fashion.  We, the teachers, have to teach them this skill.

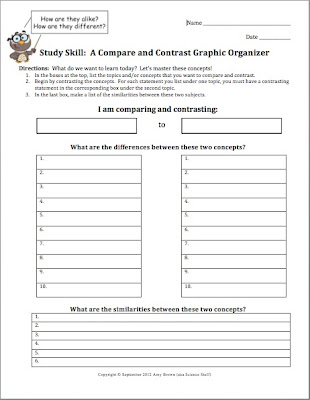
Click image to view product.
We are driven (unfortunately) by the end of course standardized tests that we face each spring.  When school starts, we are eager to jump right in and start teaching as hard and as fast as possible to get in all the standards we know will be on the dreaded test.

Let me suggest a different approach as you begin the new school year.  Teach your students skills that will make them successful learners.  Help them incorporate concept mapping into their daily study routine.  Make concept mapping a regular homework assignment throughout the school year.  You will find that students show less fear and trepidation when new information is presented, and that their retention of science information is vastly increased.

What are the cons to this?  It takes time to teach students how to develop concept maps and graphic organizers.  You will have to spend some of your valuable time at the beginning of the school year to teach the skill.  You then have to follow up.  It does no good to teach the skill unless you have students continue to use it all year long.  The information we teach in a science class can easily be organized into flow charts, concept maps, cycles and chains.

How do you teach it?  I teach my students how to construct three different types of concept maps  They are:  Concept maps or flow charts,  event chains, and cycle maps.  These three types of graphic organizers can be used for any type of science concept or reading passage.


I have developed a PowerPoint and student worksheets to aid my teaching of this skill.  In both the PowerPoint and the practice problem worksheets, students are given passages of scientific information to read.  The student must first decide what type of graphic organizer would be best for the passage.  Then, the student must organize and draw the appropriate graphic organizer.


At the end of each day, and at the end of the year, our classes should contain students who are comfortable learning and who are not afraid to tackle new science concepts. Providing the tools to establish this comfort in learning should be our goal from the first day of school.

Informational Text Reading with Graphic Organizers


Here's a great new free item for your science classroom:  
DNA Informational Text Reading with Graphic Organizers

I teach in a Common Core state, and in a school that is really pushing the implementation of the Common Core State Standards.  We have to show evidence of this implementation in our classroom.  I obviously have to do what is required of me by my admin, but at the same time, I do not want to lose valuable classroom teaching time and get behind on the vast amount of course content that I am also required to teach.

I recently developed this lesson for my students.  In our unit on DNA, RNA, and Protein Synthesis, I love to tell the history of Watson and Crick and their discovery of the structure of the DNA molecule.  In 1953, James Watson and Francis Crick rocked the scientific world with their discovery, and with the publication of their one-page paper in Science magazine describing the DNA molecule.  This one-page paper is a marvelous bit of history, and it is a fascinating read.  It is also a perfect piece of informational text that can be used to teach the Common Core State Standards.

The one-page article can be printed and used in your science classroom.  I developed a 4-page set of graphic organizers to go along with this article.  As students read the article they are required to complete the graphic organizers. You can have your students complete all four organizers (I usually do!) or each graphic organizer can be used alone. The printable lesson is perfect for traditional classroom settings, and the paperless, digital Google Apps version is perfect for distance learning and 1:1 classrooms.

You can, of course, use class time for this activity, but I usually assign this as a homework assignment.  I assign this at the beginning of my unit on DNA, and usually give a week to complete the assignment. The article and the graphic organizers provide great review on the topics I am teaching in class, as well as a lesson in the reading of informational text.  It's a win-win!  (Pssst...This is also a great activity to leave in your sub folder in the event of your unexpected absence from school!)

Here is a look at each of the graphic organizers:


(They look best if printed in color, but print perfectly fine in grayscale.)

This is a free download, and will always remain a free download.  Enjoy!

Related products include:


Common Core Graphic Organizers for Science Informational Text


Be sure to download the free graphic organizers!

Let's just face it....  Most of us have to start implementing the Common Core standards into our science classrooms. The standards cover many skills and components, but the majority of the standards deal with the reading of informational text.

I have been contending all along, that ALL reading passages in a science class involve informational text.  Our students read the textbook, current events articles, the lab manual / handouts, etc.  Out class is nothing BUT informational text.   So what needs to change in our science classroom?

Many of us need to change the WAY we teach our students to read science passages:

  • We must move away from the memorization of large volumes of facts.
  • We must teach our students how to identify the main idea, the author's purpose, etc.
  • Our students must be able to cite evidence to support scientific claims.
  • Students must be able to compare and contrast.
  • Students must be able to summarize.
  • Students must be able to identify the control and experimental variables in an experiment, citing evidence to support conclusions reached in an experiment.
  • Students must be able to express quantitative information in words.
  • Students must be able to express technical information in a flow chart or concept map.
To sum it up, we must do a better job in teaching critical reading, critical thinking, problem solving, and how to pull out the important information in a reading passage.

Like you, I have been looking for the best ways to accomplish all of this in my classroom.  To date, the most effective tool I have is ... the graphic organizer.


What is so great about the graphic organizer?  First and foremost, it gives the student a place to start.  If you hand a student a reading passage and a blank sheet of paper and instruct them to "analyze the passage", most of them are overwhelmed and have no idea how to begin.  A graphic organizer is not a crutch, it is a tool.  It helps to guide the student through the reading passage.  The graphic organizer teaches the student how to read the informational text.  

Take as an example, the graphic organizer in the above photo.  The instructions say:  As you read the passage, identify the claims being made by the author.  What evidence does the author provide to support his/her claim?"  Now the student has a reason to read the text.  Now the student knows what to look for while reading the text.


I have together a bundle of different types of graphic organizers.  Many graphic organizers I have seen are rather generic in nature.  I have tried to make mine a bit more specific.  Each is designed for a particular type of text and a particular Common Core standard.  They look the best in color, but print out just fine in black and white.  I am unable to make color copies at my school, and the black/white copies work just as well.

I have both free and paid graphic organizer products in my TpT store.  

Here are the free ones!  :)


Click above photo to download.
Good luck with your implementation of the Common core standards, and have a great school year!

Free Graphic Organizer for Comparing Groups of Living Plants


Click photo to see all of my
plant products in my TpT store.

One of my goals of late has been to spruce up, improve and update the quality of my teaching materials on plants.  No changes had to made to the content.  I love teaching plants, and I was already doing a great job with the content.  I just wanted to make my materials more attractive and more visually appealing for my students.

So what's new?  I have made a very picture-ific 97-slide PowerPoint presentation, added some crossword puzzles, a set of PowerPoint review questions, and some new daily quizzes.   I have plans for new homework assignments, study guides, and a few new labs I want to try out.  My problem is that I have more ideas than I have time to carry them out!  All in good time, I guess.

At any rate, one of the new things I have just created is a graphic organizer for comparing and contrasting the major groups of living plants. When a lot of new material has been covered, my students sometimes struggle with remembering all the details.  A teaching tool that never fails to work is a graphic organizer. When the content is logically organized and put into place, studying by the student becomes much more effective.

I have listed this new graphic organizer for plants in my TpT store.  It allows the students to compare the liverworts, mosses, ferns, gymnosperms, and angiosperms.  It is a freebie, so be sure to click the links below and grab a copy for yourself.  I hope you find it useful.


A Compare and Contrast Graphic Organizer


With the increasing amount of information that our students are expected to learn and master, it is more important than ever to provide them with the tools they need to organize and study difficult concepts.

This free graphic organizer can help your students learn to delve deeper into the content to search for similarities and differences between two topics or concepts.

Click image for free download.

This can be used in all subject areas and in grades 4 and up.  My students even admit that this technique has improved the way they view the content that we cover each day.  The graphic organizer can be used to compare and contrast any two topics or concepts.  I have used this organizer to have my students compare and contrast:
  • Photosynthesis to cellular respiration
  • Mitosis to meiosis
  • Protostomes to deuterostomes
  • Vascular plants to nonvascular plants
  • Systems of the body
  • DNA to RNA


The printable version is perfect for traditional classroom settings, and the paperless, digital Google Apps version is perfect for distance learning and 1:1 classrooms.

You can download this free graphic organizer by clicking on any of the above pictures, or on this link:


Enjoy!  ...And have fun teaching!


Science Skills: Using Graphic Organizers to Master Science Information


We all know that the volume of information in a science textbook is overwhelming for many of our students.  Take time at the beginning of the school year to teach some simple skills to help your students learn to organize the information into a manageable form.  We have a saying in my classroom:  "Be the master of the information.  Do not let the information master you."

With just a little direction students can learn a few techniques that will help them master the information all year long.   Science is so orderly and logical that the use of graphic organizers as a study technique makes perfect sense.  There are many different types of organizers, but the ones that work best for me are concept maps, event chains and cycle maps.

At the beginning of each year, I take the time to teach this important skill to my students.  I give them passages to read and then we practice organizing the information using either a concept map, an events chain or a cycle map.

At first I give the students a diagram to fill in, such as the one seen below:


But very quickly I have my students designing and drawing their own concept maps.  Once students get the hang of the technique, many of them find it to be a fun and enjoyable way to study!