menu   Home About Me Home freebies My Store  
 photo 3am_AB_f1_zps652b0c0f.png    photo 3am_ab_gplus_zps3ab6fefc.png    photo 3am_ab_pin_zpsbfebd6d2.png    photo 3am_tpt1_zpse91e0740.png   photo 3am_ab_email1_zpsebc98a17.png

Search My Blog

Showing posts with label critical thinking. Show all posts

Graphing, Scientific Method, and Data Analysis Practice

Click image to download this free product.

Great review for a vital skill.
And it's free.


Critical thinking, problem solving, and data analysis. These are terms we hear all the time as teachers of science. Let's get right to the point: We cannot stress these skills enough in our classes. We must teach our science students to be great thinkers and problem solvers! Activities that provide practice in the skills of science should be used often in our classes, and not just at the beginning of the school year. Set aside some time in your class throughout the year to review, reinforce and practice important science skills.

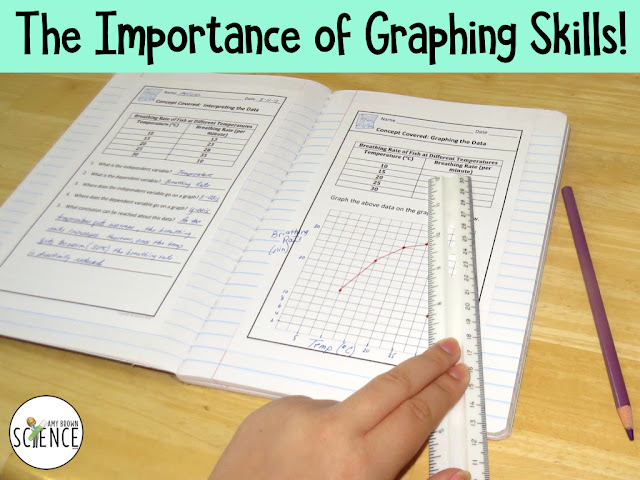
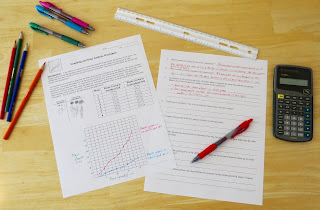
Add this free activity on graphing and data analysis to your teaching arsenal. The activity covers many important skills:  Informational text reading, data tables, graphing data, the scientific method, and data analysis.  The students will graph the data that is given in the reading, and complete a page of thought provoking questions about the data.


This activity is timeless.  I love that I can use this activity at the beginning of the school year to teach scientific graphing, but I can also use it at the end of the year for preparation for end of course testing.

Biology Warm Ups and Bell Ringers: Great Classroom Management Tool


Warm ups and bell ringers are definitely a "vintage" idea, but this tried and true classroom management tool is still effective for most classes.


Classroom management is one of my greatest strengths as a high school biology teacher. I walk into every class with a clear plan. Every single minute of instruction is accounted for before the bell rings. Over the years, I’ve learned that effective classroom management is just as essential as subject mastery, especially when teaching complex topics in biology. I strive to teach “bell to bell,” with pacing tailored to meet the needs and learning styles of my students.

But even seasoned teachers get thrown a curveball now and then.

A few years ago, I found myself with a particularly energetic group of 9th and 10th grade biology students. They were great kids—friendly, funny, and genuinely good-hearted—but they came to class every day bouncing off the walls. They weren’t disruptive in a disrespectful way, but their energy made it tough to settle in and start class on time. If you’ve ever taught high school science, you know how those first few minutes can feel: students chatting, catching up on missed work, asking about grades, turning in homework—it’s organized chaos at best.

That’s when I remembered an old favorite classroom tool I hadn’t used in a while: biology bell ringers.

Could a simple daily warm-up activity help refocus my students and establish a calmer, more productive start to class? And better yet, could I get them to keep a bell ringer notebook to track their progress?

The answer was a resounding YES! It worked.

Implementing daily biology warm-ups not only transformed the tone of my class, but it also helped reinforce key concepts and boosted student engagement from the moment they walked through the door.


What are the benefits?
You can turn this chaotic time of your class into a time of meaningful learning. Using bell ringers establishes a daily routine of having your students complete thought provoking and problem solving tasks during the first 5 minutes of the class.  Once the routine is established, students will enter the room and get right to work on the warm-up or bell-ringer activity. These warm-ups are designed to take 5-7 minutes to complete. It settles the students and provides the instructor a few minutes to carry out the tasks required at the beginning of a class.

It took a bit of time, but I now have sets of bell ringers for every chapter of a traditional high school biology class. Since most biology or life science textbooks are generally divided into ten units, I organized my warm up activities in the same fashion:

  • Unit 1:  Introduction to Science (Scientific Method, Graphing, Chemistry, Biochemistry)
  • Unit 2:  Cells
  • Unit 3:  Ecology
  • Unit 4:  Genetics
  • Unit 5:  Evolution
  • Unit 6:  Microorganisms and Fungi
  • Unit 7:  Plants
  • Unit 8:  Invertebrates
  • Unit 9:  Chordates
  • Unit 10:  The Human Body
All units have been added to my TPT store and can be viewed at this link.


The pages are printed landscape style. The pages look best if printed in color, but also look great if printed in black/white. Each activity is one-half page in size. Two identical warm-ups are printed per page in order to conserve paper. In this time saving classroom management strategy, all you have to do is print the pages and cut them in half.


The warm-ups/bell ringers require and measure a wide variety of skills: 

Compare and contrast
Identify and label
Define terms
Graphing and Tabling
Critical Thinking/Problem Solving
 Computation
Short Answer
Listing
Research
Cause and Effect
 Drawing
Analyzing
Interpreting
Predicting
Fill in the Blank
Writing/Explaining

These half-page activities can be collected and quickly graded, or you might want to have your students keep a daily warm-up notebook. These warm-ups will make excellent additions to your interactive notebooks. An added benefit ... The completed warm-up notebook makes an excellent review for the semester exam!


I now have 41 sets of bell ringers in my TPT store. You can view them all at this link

They can be purchased individually, and they are arranged into four large unit bundles:

I hope these work as well for you as they did for me.

Have fun teaching!


Science Skills: Comparing and Contrasting


I am back on my "science skills" kick!!  

I spent most of my summer refining the ways that I teach the important skills in science:  critical thinking, problem solving, graphing, metric measurements, the scientific method, etc.  In this technological age, teaching science has become much less about the "facts" and much more about the "skills".  The facts are at our fingertips....we only have to push a few buttons on our computer and the facts coming flying out at us.  Don't misunderstand, though.  I still teach a fairly traditional biology class and I make sure I cover what needs to be covered.

So what has changed in my class?  I am making much more of an effort to included activities, worksheets, and labs that are not as much "content based" as they are "skills based".  The science portion of the ACT test is now called "Science Reasoning".  The AP Biology curriculum is being changed next year in favor of an inquiry approach to biology.  These changes are good.  The message to science teachers is "Teach your students how to THINK!"


Most science teachers would agree that students who have developed good "science skills" will be far more successful in a science class than those students who simply memorize a laundry list of science facts.   In my attempt to include more problem solving activities, I wrote this lesson (see link below) and just tried it out in my Biology I classes today.  It was a lesson (or a review) in "comparing and contrasting" for the science student.

I began the lesson with a short PowerPoint presentation.  I wanted my students to understand what it means to "compare and contrast".  During the Powerpoint presentation, students were asked to compare two living organisms.  The students made a list of the similarities and differences between these two organisms.  After comparing and contrasting the two organisms, I had the students determine why these similarities and differences are important to these organisms.

The PowerPoint presentation was followed up by 5 page student worksheet.  This worksheet made the students practice over and over the skills of comparing and contrasting.  The questions were thought provoking and required problem solving and critical thinking skills.


This lesson can be used at different times of the year.  Next year, I plan to use it at the beginning of the school year to get my students "thinking like a scientist".  Today, I used this Powerpoint and worksheet to introduce a unit on classification and taxonomy.  This lesson would also work extremely well when teaching a unit on Evolution.

I think this approach to teaching science will really pay off for my students as they take the ACT and AP exams.  As they were moaning and groaning over today's assignment, I reminded them, "No pain, no gain!!"

Here is a link to the product, if you are interested.

Science Skills Worksheet and PowerPoint:  Comparing and Contrasting

Graphing Skills Are Life Skills!


Graphing: Make this a part of as many lessons as possible!

The lessons learned in a science class go much further than just learning the parts of the cell, or the parts of an atom, or the names of the invertebrate phyla, or the trends seen on the periodic table.  We teach important skills that our students will carry with them for the rest of their lives.  Skills such as graphing, metric measurement, cause and effect, percentages, scientific method, logical problem solving, and critical thinking are required for LIFE!

For this blog post, I would like to focus on graphing skills.  I fear that the use of graphing calculators and laboratory probe systems is doing too much work for our students.  I do love using technology in my classroom and lab, but I think that too much of it is actually hurting our students.  Many students are reaching my high school science classes without a clear understanding of how to construct a graph. We need a healthy balance between allowing technology to do the work for us, and doing the work for ourselves. 

There are so many benefits of giving the student a pencil, a ruler, and a piece of graph paper.  

  • Graphing the "old-fashioned" way improves fine motor skills and hand-eye coordination.
  • Graph construction forces the student to think about the independent and dependent variables and to consider which axis to place them on to show a logical correlation between the two.
  • It provides an excellent opportunity to teach our students to "think ahead of the problem" to consider if an outcome or conclusion is logical. 
  • Every standardized test our students take will require them to analyze graphs and tables.  Data analysis is a hard concept for many students, but requiring them to construct their own graphs and tables encourages deeper thinking of the data shown on the graph.
  • There is no better way to teach "cause and effect" than by graphing data.
  • Graphing provides a pictorial representation of data which helps students learn to draw accurate conclusions.

Obviously, we want students to become masters of problem solving and critical thinking, and teaching graphing skills all year long is one way to assure that our students are good thinkers.  Make your labs and classroom activities "quantitative" in nature whenever possible.  Especially in biology, many activities are "qualitative" and involve drawing and describing, but we need to constantly look for opportunities to use labs and other lessons that are math-based and involve the collection of numerical data. 
  • Look at the labs you are currently using with your students. Is it possible to have students graph the data they collect?  If so, then always require it!
  • It is really important that students construct graphs that have more than one line of data on the same graph.  By placing several lines of data on the same graph, students can quickly see the correlation between the independent and dependent variables.  It provides excellent practice in how to analyze data to reach a proper conclusion.
  • You can provide additional problem solving questions to accompany the graphing activity, such as "What do you suppose would happen if this were changed....", or "What would be the outcome if...."
  • Include interpolation and extrapolation questions whenever possible. Students need to be able to predict new outcomes based on the data shown on a graph.
I hope these reasons will convince you to include more tabling, graphing and analyzing of information.  But, please!!!  No graphing calculators until your students are proficient at graphing and data analysis skills!!!  I firmly believe the calculator is crippling our students.  The calculator is a wonderful tool.....but AFTER the student can do the skill without the calculator.

If you need help with incorporating more graphing and data analysis into your classes, these resources will help:

Tabling, Graphing and Analyzing Data - PowerPoint with Notes for Teacher and Student

Graphing Practice Problems - Great graphing practice with critical thinking questions.

Graphing and Data Analysis - This is a free download that provides good review and reinforcement in graphing and data analysis.

Graphing, Scientific Method, and Scientific Writing - More great science skills practice!


The following lab activities require graphing as a means of data analysis:

Using a Graph to Find Area - This is another free download and a good graph is the only way to solve the problem.

Lab:  Acids, Bases and Cells   Requires extensive graphing of results.

Modeling Population Growth

The Effect of Concentration on the Rate of Diffusion - Another free download!


Teach the Skills, Please!


Science classes can be crammed so full of facts and memorization that I am afraid that we lose site of what science is really all about.  Science is about discovery and inquiry.  Science is about investigation.  Science is about applying a method to solve problems and answer questions.  When I first began to teach, I thought long and hard about what type of science teacher I wanted to become.  In my years of schooling I had science teachers that never did an experiment and made me memorize a bazillion facts that I forgot as soon as I took a test.  I also had science teachers that set me on fire with curiosity and a desire to learn "more."  I wanted to become a teacher like this!


It is important to make your science class lab-based and inquiry driven.  As a teacher of biology, I know that Biology is full of facts and details.  I still try to teach all of these facts, but the facts are mixed in with as many science skills as possible.  No matter what the topic, you can have the students graph, analyze, predict, and describe.  Students need to be taught to design and carry out a controlled experiment.  At every opportunity, I ask my students, "What do you THINK would be the affect of changing this variable?"  And as often as possible we go to the lab to see if their predictions can be proven or disproven.


When I first began to teach, the science portions of many standardized tests were testing the students to see if they knew the "facts."  This is no longer the case! When I took the ACT, I received a score in "Science."  When my daughter took the ACT, she received a score in "Science Reasoning."  Standardized testing in science has changed!  The students must be able to read and comprehend scientific passages.  They must be able to analyze graphs and charts.  If you are not teaching these skills to your students, then you are not preparing them for these tests.

Please don't think I am a proponent of "teaching to the test."  Nothing could be farther from the truth. If you are teaching the necessary problem solving and critical thinking skills, your students will ace these tests.

What have I learned after 31 years of teaching science?

  • If I teach the necessary "skills" first, the "facts" will fall nicely into place.
  • Spending extra time at the beginning of the school year on graphing, metric system, experimental design, scientific method, and math skills such as scientific notation and dimensional analysis will make the rest of my school year much, much easier.
  • The skills we teach in science class are life-long skills.  By teaching critical thinking and problem solving, we are preparing students to be competent in whatever they decide to do as adults.

If you are a biology or a life science teacher who is wondering how to get started, you might want to give some of these activities a try.

How to Write a Clear and Concise Lab Procedure
Graphing and Data Analysis
Using a Graph to Find Area
The Student-Designed Experiment